Increase Revenue Fast With Conversion Rate Optimisation
Welcome back, Rankers!
Listen, we’ve been doing this show for 13 years so if you haven’t subscribed, maybe now is the time, and if you get any value out of this at all, please share it with your friends. And wherever you want to share it. That’d be awesome. Thank you.
4,800% Revenue Increase. Really?
I want to talk to you a bit about last week’s show because one of our clients messaged me, or I was talking to him during the week. He said, 4,800%, seriously? Come on, you always go with the tabloid headlines. No I don’t think they are tabloid, I think they’re more click baiting than anything.
But he did make his point because last week’s show highlighted how we had an increase of 4,800% in Bing revenue simply by changing links on a page. And it wasn’t insignificant revenue either, it was a few thousand bucks, so better than a poke in the eye.
So this week I thought I’d show you that client’s data that rang up and said, come on mate, you’ve been a bit tabloidy. So I thought, okay, we’ll be less ‘tabloidy’ this week.
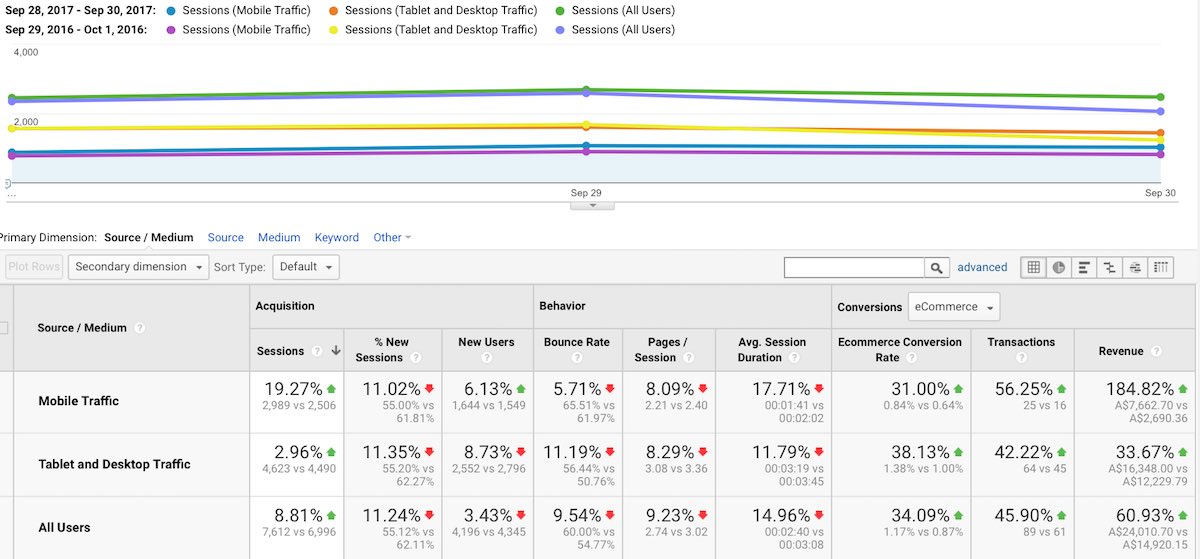
We’re going to start with a 184% increase in revenue on mobile phones, year on year. These are changes we made last Thursday, so I’ve got three days of data here and comparing it year on year. This client has a seasonal business in that it’s affected by the weather, so we have to do it year on year. Just going the previous week won’t work because the weather is changing so therefore their revenue and data changes.

So 184% increase in mobile. There’s a couple of things to look at here, in that we’ve only increased mobile traffic by 19%, which really is not a lot, and this site has been suffering from Google quality updates. It is a custom built CMS retailer and so it will have a lot of issues which can’t easily be resolved. Things like canonicals, restrictive page titles, restrictive menu, and every time we want to change things it has to go through a 3rd party developer so there’s extra costs and all those sorts of things.
It’s a complex situation for this client, so we were looking at organic traffic decreasing. Someone else had taken over their ad words. We were doing it last year, he was trying someone else and they haven’t been doing too well, so they were losing a lot of revenue all round.
Track Your Visitors
We said, okay, let’s stop and take a moment here and really work on just getting some revenue in, and so we went through, we heat mapped the stuff, which is what you’ve got to do, and if you haven’t heat mapped, there is a bunch of them out there. Crazy Egg, we use Hotjar.
Hotjar does the videos as well. I think Crazy Egg does as well now, where you can actually see the video screen captures of users moving around the site and how they use the site.
I don’t find the videos that useful, mainly because you need to wade through a lot of videos to get any sense of any real sample size. At the moment, I’m only looking at three day sample size because that’s when we made the changes, so not really big at the moment, but certainly over all 184% increase in revenue on mobiles, which is awesome, but 61% revenue increase overall for the same period year on year.
Right there, for a couple of changes I made last week, and I did spend a lot of time thinking about these changes, researching the changes, looking at the heat maps and then making a decision.
The result I thought we were going to get was about an extra 50k a month for this client. Looks like it’s going to be significantly more, looks like it’s going to be about 3k or 4k a day, which would be awesome. It’s going to depend on the weather and a whole bunch of other things, but the thing to look at when you’re doing these changes, is, well obviously you want to see what the bottom line is doing, but you may have some outliers or some transactional anomalies, or things that can throw the data or skew the data.
I think it’s important to focus on your e-commerce conversion rate. When I go in and look at Google organic, the changes to conversion rates are particularly awesome. One I’m looking at here, I’ve got mobile traffic, tablet and desktop traffic, and all users, and you can see right up, our sessions are down. Organic is down on last year, and we are working hard to get that back up but it’s difficult with the quality issues
that we have with the site.
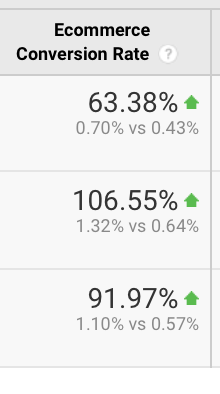
That being said, and that includes things like speed and restrictions and those sort of things. That being said, revenue is up on mobile for this period year on year, for 58%, 57% and 57% overall for organic. What is interesting is the e-commerce conversion rate. The e-commerce conversion rate is 106% up on desktop and 63% up on mobile, so we’ve gone from .64 to 1.32

I want to get that up even higher, and I think we can. I believe we can, but overall we have doubled, well 91%, 92% the conversion rate for organic. That should mean that the revenue is also going to double over time. We need a bigger sample size of course, but these are the things that you’ve got to look at when it comes to your website and conversions and some slight things that you can do for quick wins.
So I’ll go back and have a look and see what else we’ve gained here. Primarily it is in organic. When we look at CPC, we’re not doing the CPC at the moment, you can see here the desktop is down 37%. You can see that the e-commerce conversion rate is down 36%, but the revenue is up 97% on mobile. But look over here, we’ve got an extra spend over here, we’ve got 26% more traffic, so we’ve thrown more traffic at it. Costs are therefore higher, e-commerce conversion rate has dropped.
That’s not what you want to see. You want to see that e-commerce conversion rate go up, so no matter how much traffic you throw at it, you know it’s going to keep increasing the revenue.
Just thought I’d share that one with you because it’s a pretty cool number. 184% on mobile, and some of these changes … and you are going to say what was the change Jim?
Harvest Revenue from Organic Changes
Well, what we did is we had a look at what, for organic, and this is why I think we’re seeing bigger changes in organic. Well, we’re still getting big changes in direct, so direct is up as well, and so these changes have affected direct positively, and also referral traffic positively. Not AdWords though, and I don’t know why as I haven’t looked to see what’s happening with their AdWords campaign, because we’re not looking after it.
The interesting thing is that you can make those small changes. In this case we looked at what are the highest traffic key phrases, and we looked at where is the prominence of those key phrases when people hit the most popular pages, and we just basically raised the prominence. We basically put an extra link in the nav menu for that thing that people were looking for. All we did was make it quicker and easier for users to find what they want.
So we’re talking user experience. Now I haven’t seen any effect on ranking since we’ve done this change. You’ll hear a lot of people talking about the user experience affects rankings in Google, and it does because user experience covers things like speed. I haven’t seen any changes to the rankings since we’ve made these UI changes which is essentially what they are. Fairly simple UI changes, just making it easier. Obviously with this site, we’ve got rid of sliders and we’re looking at what is trending on a seasonal level and making sure that those things that are trending on a seasonal level are really, really easy to get to when the user hits the site on a mobile, and on a desktop.
They are some of the simplest things you can do but you need to heat map it, you need to have a look and see where people are going. I would also recommend having a look at some of the user flow graphs inside Google analytics. That might give you some insights as well and also one of the things that we’re doing, and I hope to have some hard data on this over the next couple of weeks, is throwing people more in to search, because … when I say search, I mean site search, because for most of the retailers that we look at, if users have gone through site search, it’s usually a higher conversion rate, and sometimes it’s about three times the conversion rate of people who don’t use site search.
That can be a couple of things. They are a more active user, they are a more keen user, they’re actually looking for a thing, but it also could mean that people who use site search are finding the things quicker and easier than otherwise they would through say, the nav menu. For some of these things that we’re putting high on the nav menu, they’ve been difficult to get to through just by going through the nav menu, which is why we’re boosting them higher. Because they are quite popular and people want to find them, and when they find them and they find them quickly, they tend to buy more.
Hopefully that’s helpful, and we’ll see you next week. Thanks very much everyone. Bye.

Jim’s been here for a while, you know who he is.


